quick guide using technology to create a standard curve
Quick Guide: Using Technology to Create a Standard Curve
What is the importance of a DNA Standard Curve?
Agarose gel electrophoresis separates cut DNA into discrete bands, each comprising molecules of the same size. How can these results be used to determine the lengths of fragments in the restriction digests? Remember, as the length of a DNA molecule increases, the distance to which the molecule can migrate decreases because large DNA fragments cannot pass through the channels in the gel with ease. Therefore, the migration rate is inversely proporational to the length of the DNA fragment - more spedivically to the log10 of fragment length. To illustrate this, we ran s ample that contains DNA strands of known lengths called a "standard." In this exercise, we will use technology to measure the distance that each of these standard DNA fragments traveled. We will then use a computer-graphing program to create a "standard curve," which can then be used to extrapolate the size of unknown DNA fragments.
In order to perform the quantitative analysis, students will need a computer with image analysis software and a graphing program capable of finding a best-fit curve.
This tutorial was developed using ImageJ Version 1.50, an image-processing program developed at the National Institute of Health. It is in the public domain and so can be freely downloaded and installed. Detailed download instructions can be found HERE. In order to run ImageJ, you will need to have Java running on the computer. Please consult the appropriate technology support personnel for your institution for assistance.
Using ImageJ to Make Measurements on an Agarose Gel
Take a picture of your gel using a gel photodocumentation system, a digital camera, or cell phone. While ImageJ supports many photo formats, we recommend using TIFF, GIF, or JPEG files.
Open the picture file using ImageJ.
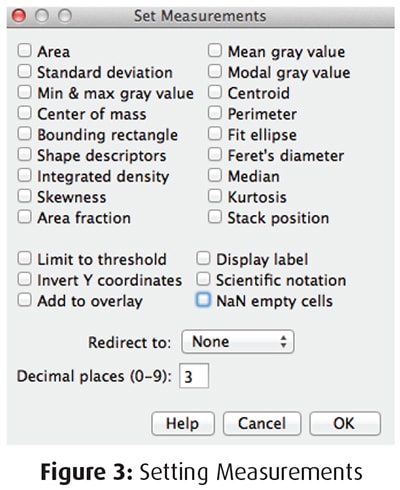
Using a line tool, draw a line connecting two points of known distance. In this example, we know the gel is 7cm wide, so we will use a line that connects the left and right edges of the gel (Figure1). To draw a perfectly horizontal or vertical line, hold down the shift key while drawing the line. NOTE: If you do not know the dimensions of your gel, be sure to include a ruler in your picture to use for scale.
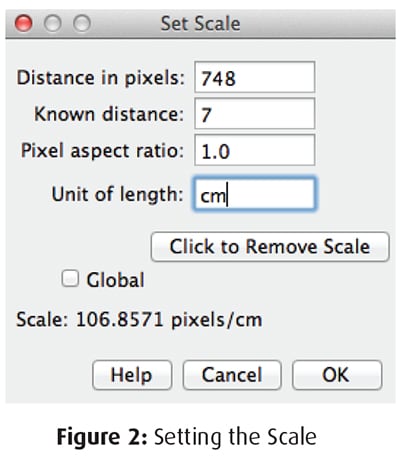
Next, set the scale of the measurement. Make sure teh scale line is still selected. Go to Set Scale in the Analyze menu. This will bring up a small menu. The distance in piexels is the distance of the line we drew (Figure 2). We know this line is 7cm, so we will fill in known distance as 7 and the unit of thelength as cm.
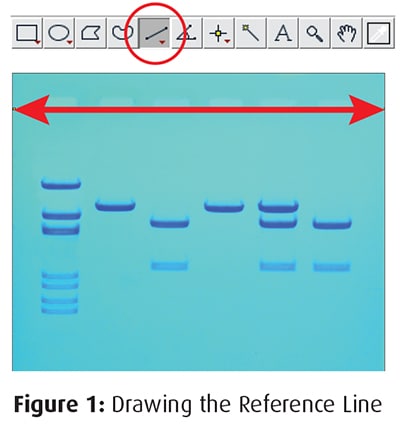
Next, go to Set Measurements in the Analyze menu (Figure 3). Select any parameters that you would like to measure. In this case, we just want to measure length, so no boxes need to be checked.
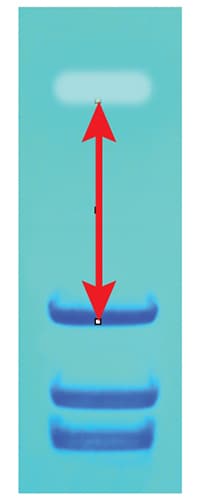
Using the line tool, make the first measurement. We are measuring from the bottom of the well to the bottom of the band (Figure 4). You can choose to measure from any point as long as you are consistent. With the line selected, go to Measure in the Analyze menu. The measurement will be brought up in a results box as Measurement 1.
Repeat this process with each measurement to be made. Be sure to keep track of the order of each measurement you make (in this example, Measurement 1 is the top band in the DNA standard marker, and so on.
After completing the measurements, create a DNA standard curve.
Using Measurements to Create a Standard Curve
Using a graphing program like Microsoft Excel or Google Sheets, plot the distance each Standard DNA fragment migrated on the x-axis (in mm) versus its size on the y-axis (in base pairs). Be sure to label the axes!
Because migration rate is inversely proportional to the log10 of DNA length, the data points do not appear to follow a straignt line. Using a logarithmic scale on the y-axis will produce a straight line and allow us to analyze an exponential range of fragment sizes. The scale of the axis can be changed in the chart or axis settings menu.
After all the points have been plotted, use the graphing program to create an exponential best-fit line. The line should appear straight because of the logarithmic axis. If not, go back to Step 3 and set the y-axis to logarithmic.
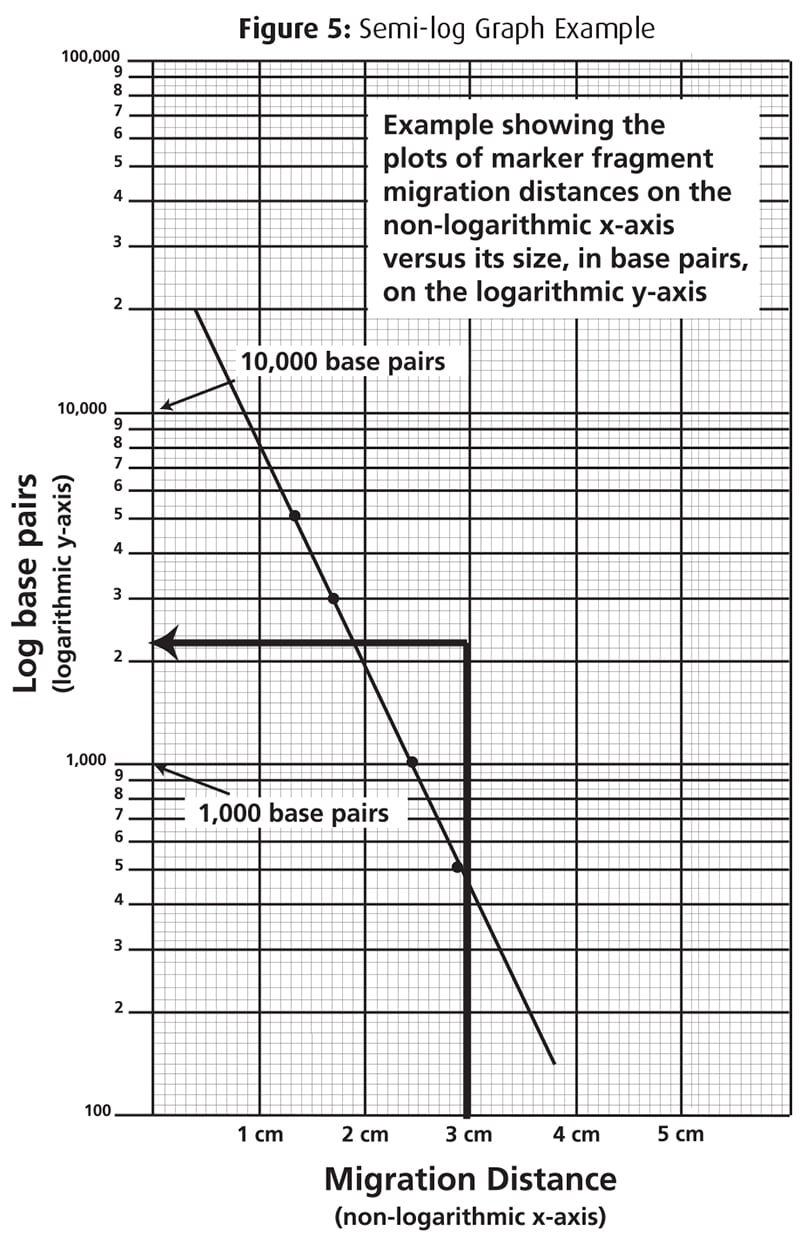
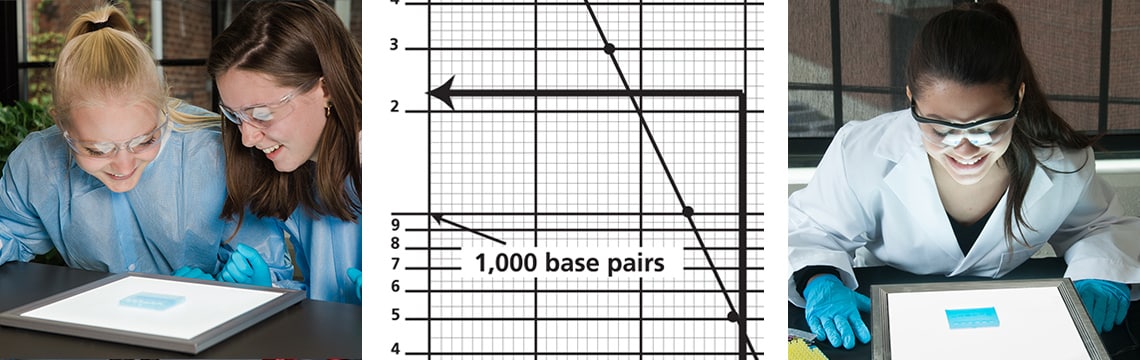
Use the best-fit line to determine the length of each unknown fragment. This can be down in one of two ways. a. Locate the migration distance of the unknown fragment on the x-axis of your semi-log graph. Draw a vertical line extending from that point until it intersects the line of your standard curve. From the point of intersection, draw a second line, this time horizontally, toward the y-axis. The value at which this line intersects the y-axis represents the approximate size of the gragment in base pairs (refer to Figure 5 for an example). Make note of this in your lab notebook. b. Use the equation of the line to solve for y, the size of the DNA fragments. After substituting the distance traevled in to the equation for x, the resulting y value represents the size of the DNA fragment.
 Agarose gel electrophoresis separates cut DNA into discrete bands, each comprising molecules of the same size. How can these results be used to determine the lengths of fragments in the restriction digests? Remember, as the length of a DNA molecule increases, the distance to which the molecule can migrate decreases because large DNA fragments cannot pass through the channels in the gel with ease. Therefore, the migration rate is inversely proporational to the length of the DNA fragment - more spedivically to the log10 of fragment length. To illustrate this, we ran s ample that contains DNA strands of known lengths called a "standard." In this exercise, we will use technology to measure the distance that each of these standard DNA fragments traveled. We will then use a computer-graphing program to create a "standard curve," which can then be used to extrapolate the size of unknown DNA fragments.